

Today we’ll talk and discuss about fundamentals in the Statistical “environment”, mainly focusing on what a statistical population is, how a data set is buildt and how a frequency distriubution works.
First of all, in statistics, a population is defined as a set of similar items or events which is of interest for some question or experiment, so it can be a group of actually existing objects (e.g. the set of all stars within the Milky Way galaxy) or a potentially infinite group of objects conceived from experienced events (e.g. the set of all possible hands in a game of poker).
Basically, a statistical population is any group of individuals that are the subject of a study, meaning that almost anything can make up a population, so long as the individuals can be grouped together by a common feature. Although, due to time and accessibility, it is nearly impossible to perform a measurement on every subject, so inferential statistics steps in and scientists are able to study only a small portion of the population and still observe tangible results.
If a subconcept of a population shares one or more additional properties, it’s called a subpopulation.
 Just to give an example, if the population is all Italian people, a subpopulation is all Italian females. By contrast, a sample is a subset of a population that is not chosen to share any additional property.
In any case the “population” terminology can be used in a inference approach (which is this case) or even the standard descriptive approach.
A data set is any permanently stored collection of information or data. Another frequently used way to name it is database. Most commonly, a data set corresponds to the contents of a single database table, or a single statistical data matrix, where every column of the table represents a particular variable, and each row corresponds to a given member of the data set in question. A clear and unique definition is still about to be found tho. Another definition of a data set is a collection of related, discrete items of related data that may be accessed individually or in combination or managed as a whole entity, organized into a data structure.
For each variable, the values are normally all of the same kind. However, we need to consider that there may also be missing values, which must be indicated in some way. In statistics, data sets usually come from actual observations obtained by sampling a statistical population, and each row corresponds to the observations on one element of that population. A data can be raw if those haven’t been processed yet, so that they’re represented exactly as they were captured. It’s called quantitative data any data that is in numerical form. On the other hand a qualitative data cannot be expressed as a number. Data such genders are usually considered to be qualitative data. Although, only quantitive data can be analized in statistics, so that qualitive datas can be used too, but need to be converted into a numeral scale before.
Qualitative data describes, whereas quantitative data defines.
To measure data – being them qualitative or quantitative – a scale of measurement is needed. A scale of measurement is a classification that describes the nature of information within the values assigned to variables. The best known classification of data is given by defining four levels of measurement:
- nominal level: this level only satisfies the identity property of measurement, so it’s only possible to say if two values are the same or different. Gender is an example of a variable that is measured on a nominal scale. The available mathematical operators are = and < > (or !=)
- ordinal level: this level allows for rank order (1st, 2nd, 3rd, etc.) by which data can be sorted, making it possible to order data and specify which precede the other. The available mathematical operators are > and <.
It also includes the nominal level. - interval level: this level allows for the degree of difference between data, but not the ratio between them. An example of an interval scale is the Fahrenheit scale to measure temperature, or different birth dates, since with an interval scale, you know not only whether different values are bigger or smaller, but also how much bigger or smaller they are. The available mathematical operators are + and –.
It also includes the nominal and ordinal level. - ratio level: in contrast with the interval level, this one allows the ratio between data. The weight of an object would be an example of a ratio scale. A ratio scale possesses a meaningful (unique and non-arbitrary) zero value, since – given the weight example – objects at rest can be weightless, but they cannot have negative weight. Most measurement in the physical sciences and engineering is done on ratio scales. The available mathematical operators are * and /.
It satisfies all four of the properties of measurement, including the nominal, ordinal and interval level.

One of the common methods for organizing data is to construct a frequency distribution. As a statistical tool, a frequency distribution provides a visual representation for the distribution of a particular variable in an organized tabulation of individuals, in each category on the scale of measurement. Another way to put it is that a frequency distribution is a mathematical function showing the number of instances in which a variable takes each of its possible values.
If there’s only a variable involved it’s a matter of univariate frequency, while if two or more variables are involved, that’s the case of a multivaried frequency. 
We could say it’s a way of showing unorganized data, to gain a summary of the whole depiction, while deleting useless informations for the analysis’s purpose. Frequency distributions are used for both qualitative and quantitative data.
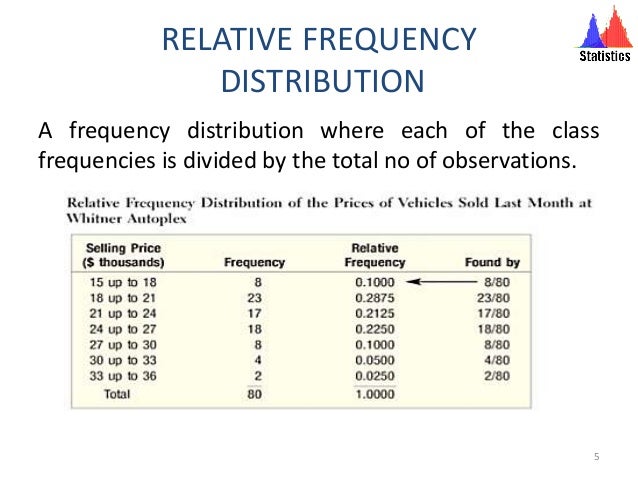
So if a frequency distribution is a pattern of frequency of occurrence in a sample as a representation – either in a graphical or tabular format – that displays the number of observations within a given interval, a relative distribution is a type of it, in which we don’t want to know the counts of the occurrences, but the percentages instead.
That’s because a relative frequency is made by dividing the count by the total.
A simple way to identify a relative distribution chart is to look at the vertical axis, where only percentages should be displayed, instead of counts.
Finally, it’s interesting to notice an aspect in statistical frequency studies, which is that even letter frequency distributions are also used in frequency analysis to crack codes and are referred to the relative frequency of letters in different languages.
Glossary:
Population:= (in statistics) a set of similar items or events which is of interest for some question or experiment.
synonyms: group, settlement, community, populace.
Data set:= a collection of data.
synonyms: dataset, database, data table, data matrix, data file.
Scale:= (measuring) an instrument used to measure things like weight.
synonyms: proportion, range, rate, progression, ranking.
Distribution:= (frequency distribution) a list of the values recorded in a sample.
synonyms: trading, assigning, division, partitioning, unity, collection, gathering, classification.
